TriUmphant Training Platform
Helping you athletes achieve all that they can
October - January 2020
Click anywhere to exit
How do you triumph?
Triathlon training is hard. Creating a training plan to fit your schedule, updating that plan when conflicts arise, and tracking performance metrics to use in progress analysis can be a TON of work, especially when all this is on top of training for ten or more hours a week. All this work creates a barrier to achieving performance goals within triathlon that many people struggle to overcome, while others are scared off entirely from the sport.
To better support triathletes, like myself, in our training endeavors, I created TriUmphant, a tracking, and planning application for triathlon training. TriUmphant emphasizes accommodating the needs and desires of the triathlon community by offering greater automated support for planning out training, adapting that plan to unexpected conflicts, and interpreting the data athletes collect through various devices.
Over about three months, I independently worked on this as a side project in my time outside of work and school. I drew inspiration partially from my own training experiences while relying heavily on feedback from the triathlon community as my user base.
Discover
User Surveying: Finding the Standard Triathlete
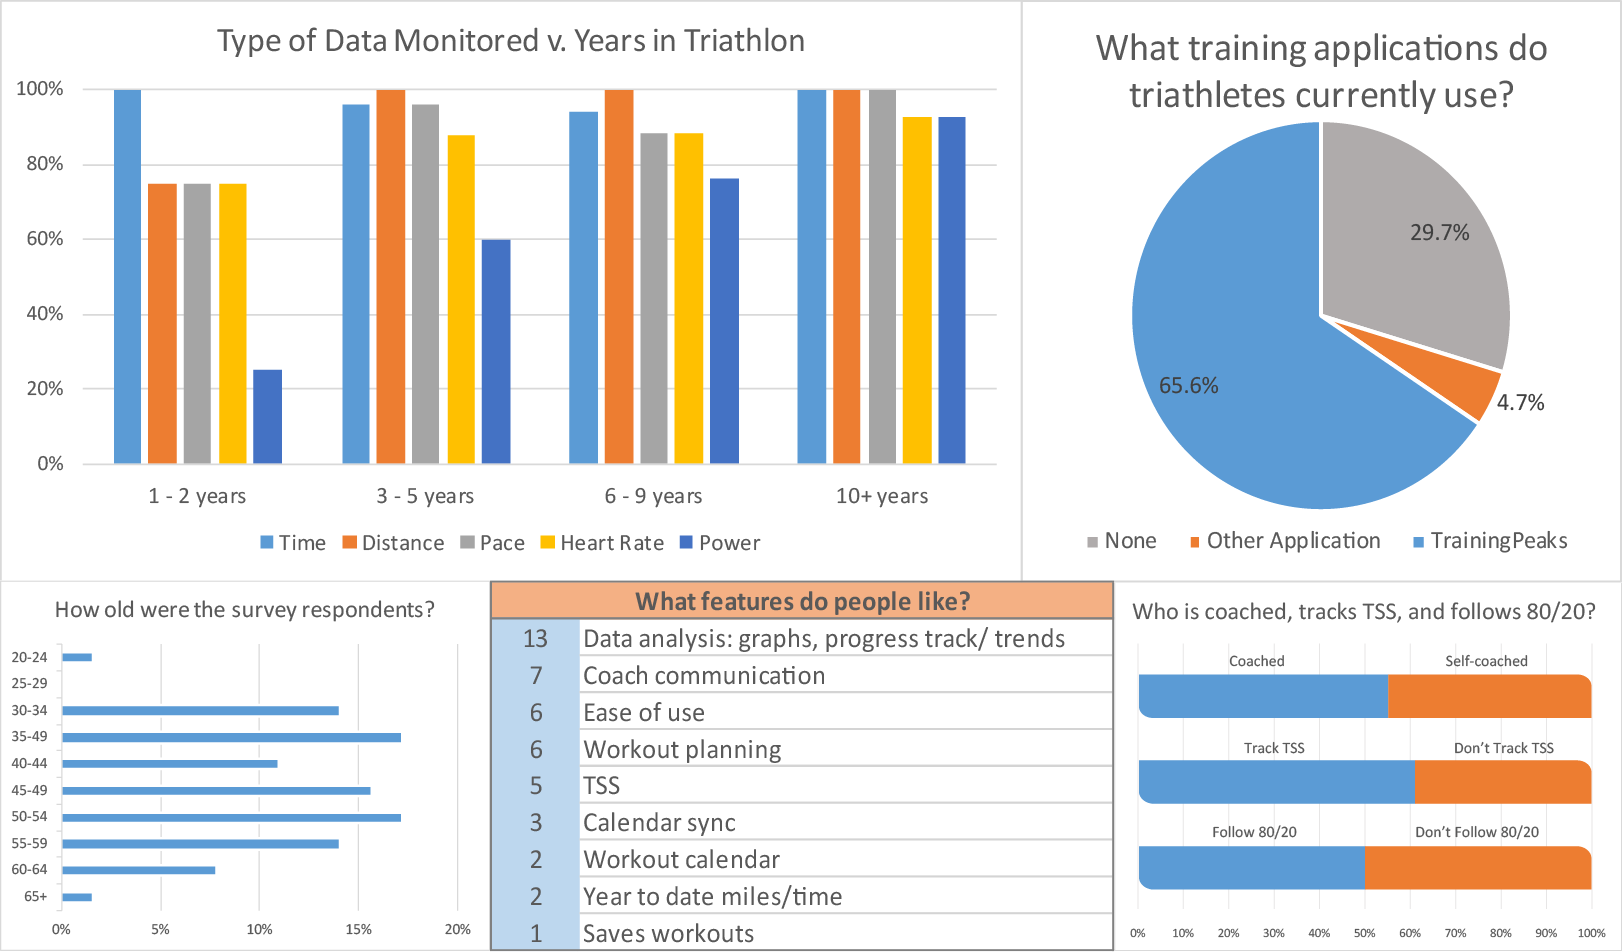
I've been doing triathlon for multiple years, but in that time, I've learned that although triathletes share a lot of common personality traits, we also vary greatly. I had to figure out who is the standard triathlete . How old are they? How long have they been in the sport? How often do they train? What metrics do they track when they train? How do they plan their training?
To find answers to these questions and more, I created a survey to collect this information and posted it in a triathlete Facebook group with 3K+ members. From my 64 respondents, I collected the following information:
64
Total Respondents
46
Average Respondent Age
70%
Currently use a tracking application
88%
Use a Garmin product
97%
Track at least Time
User Surveying: Triathletes' Why's
Following the first survey results, I still had a lot of unanswered questions about why certain people make the training choices they make. For instance, why get a coach? Why not get a coach? Why track training stress? Why not track training stress? Why train easy most of the time? Why prioritize training hard? So I sent out a follow-up survey to about half of the initial respondents (those who had indicated at the end that they would be open to providing further feedback), asking several short "why" questions. From my 27 respondents, I learned the following:
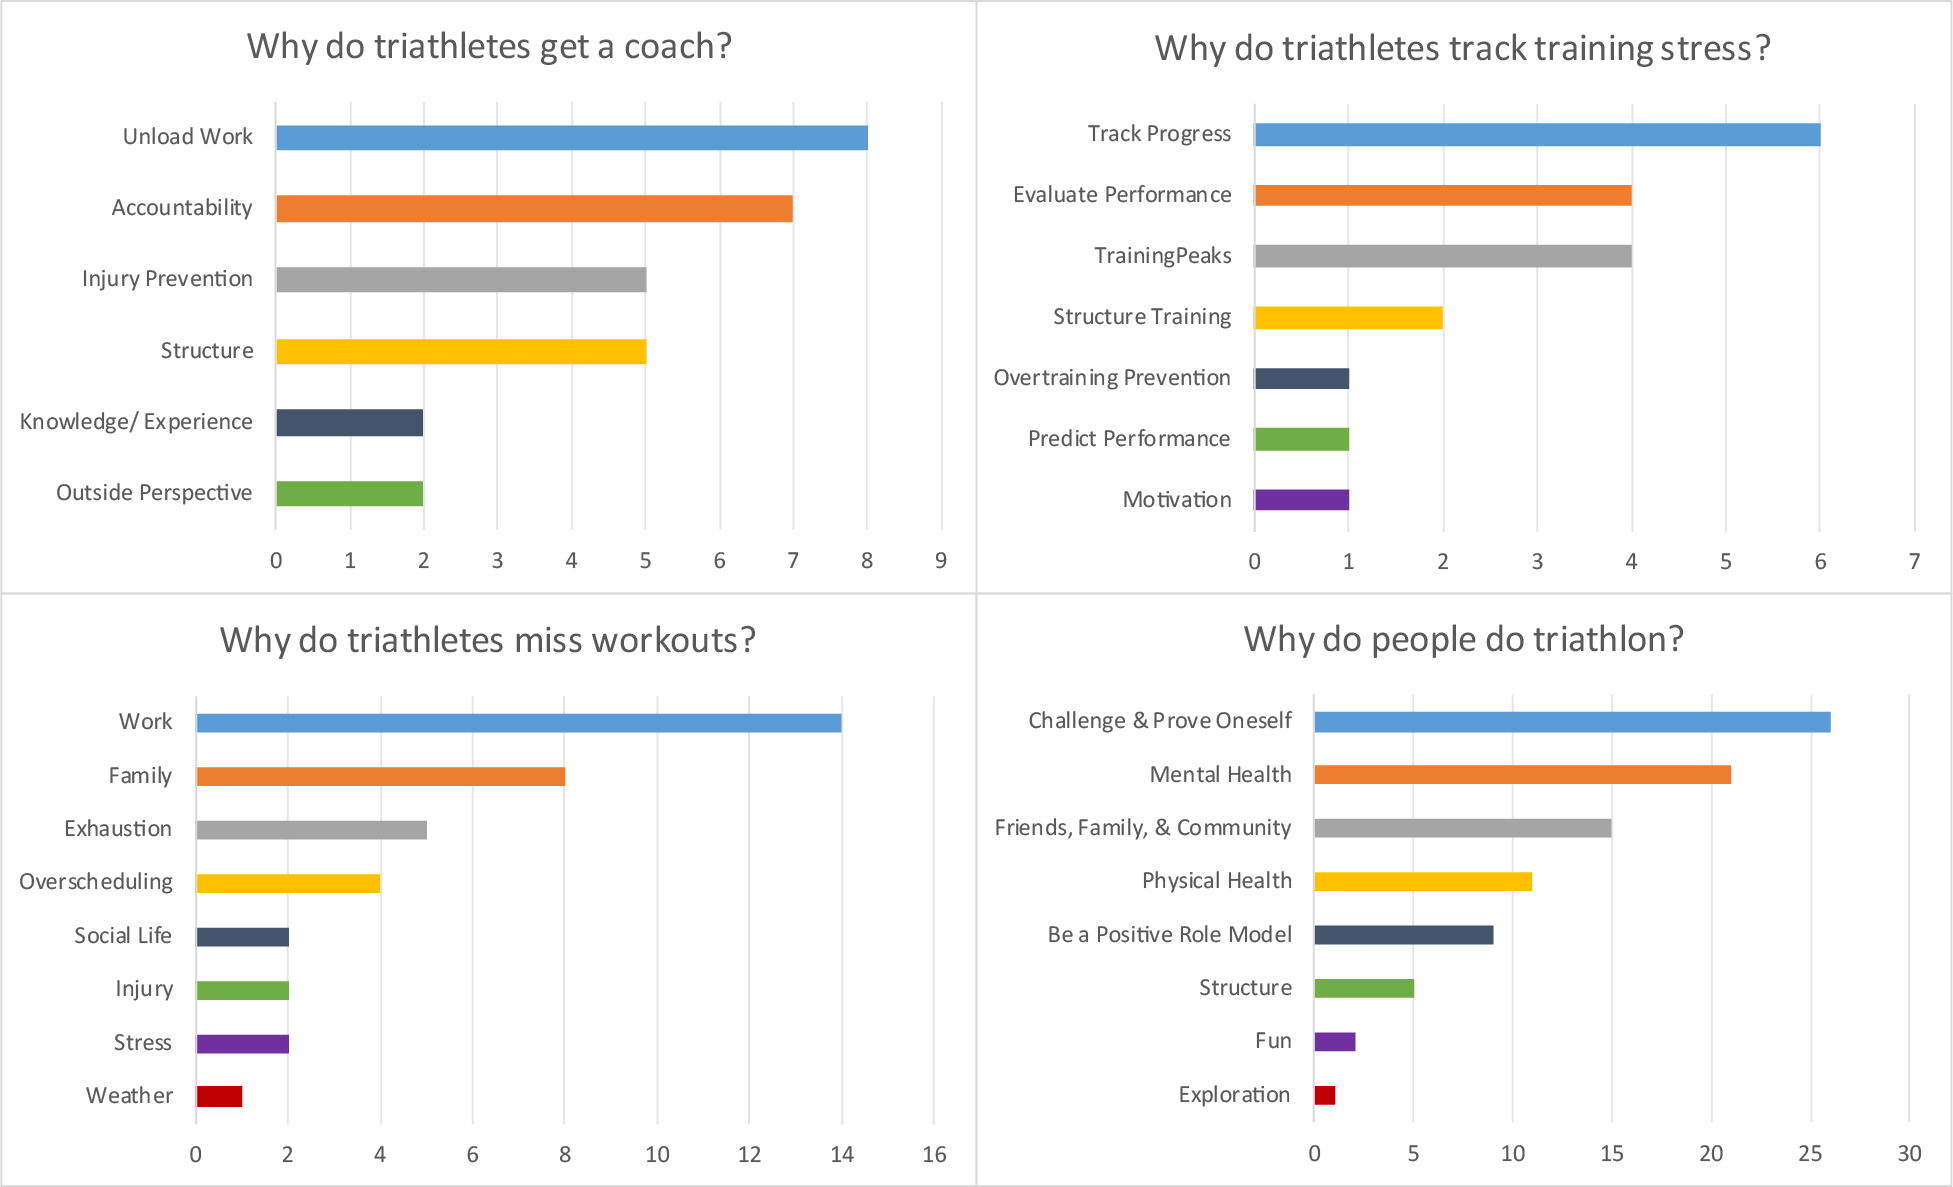
Values represent number of responses
Competitor Analysis & Heuristic Evaluation
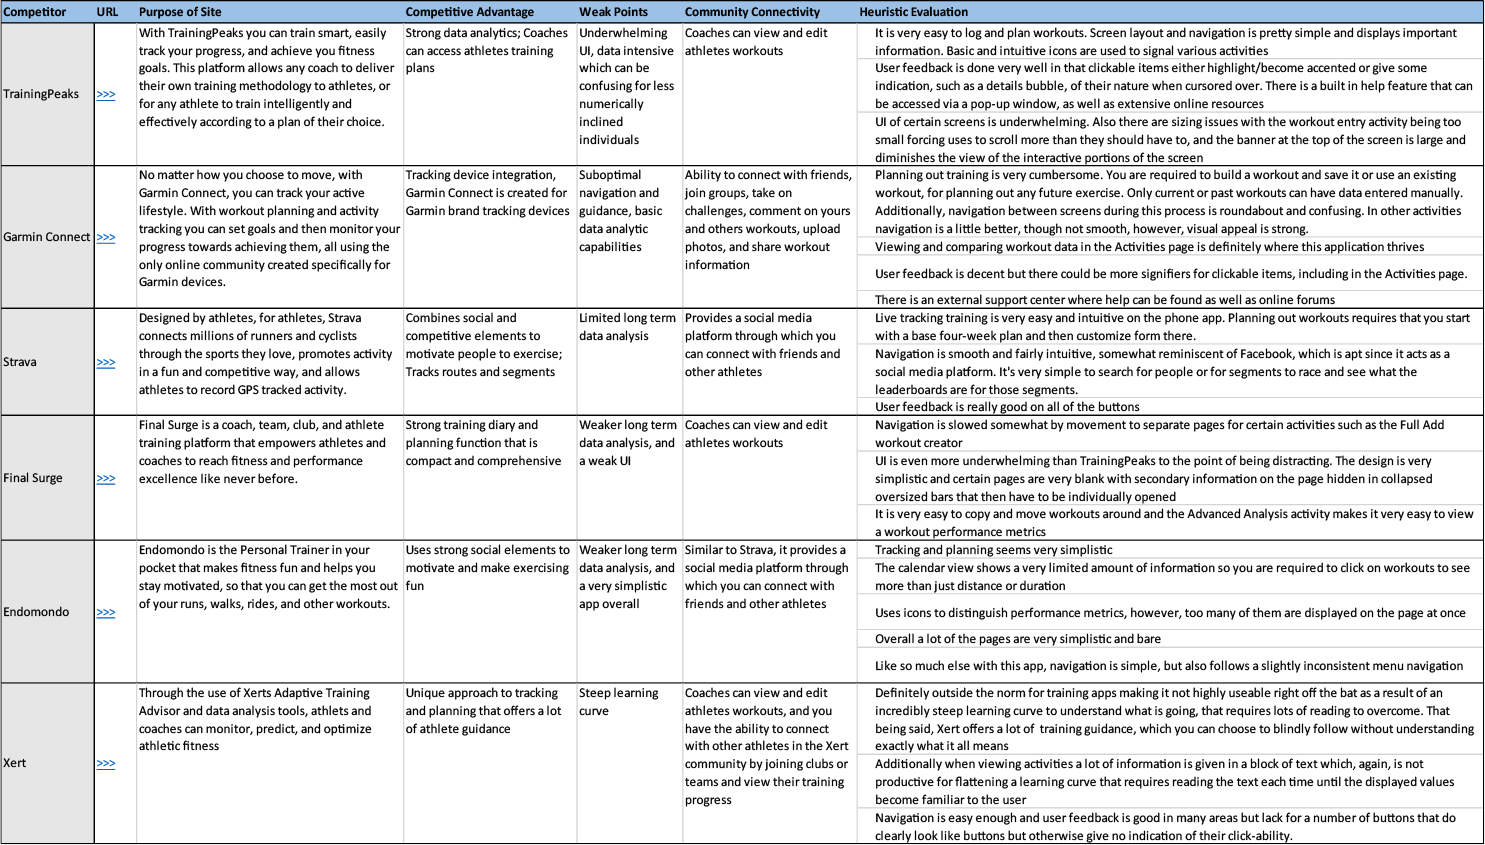
In addition to gathering user feedback, I was aware of several tracking and planning applications on the market that each utilized unique functionality. Thus, it was prudent to conduct a competitor analysis & heuristic evaluation of the most popular applications among triathletes. Based on my survey feedback, TrainingPeaks was a clear preference for most triathletes, making it the primary competition. Still, I made a list of 5 other popular applications to review. I evaluated each for its primary focus, competitive advantages, weaknesses, community connectivity, and heuristic capability. I created this table to document my findings and use as a reference for decisions making in my design.
Define
Personas
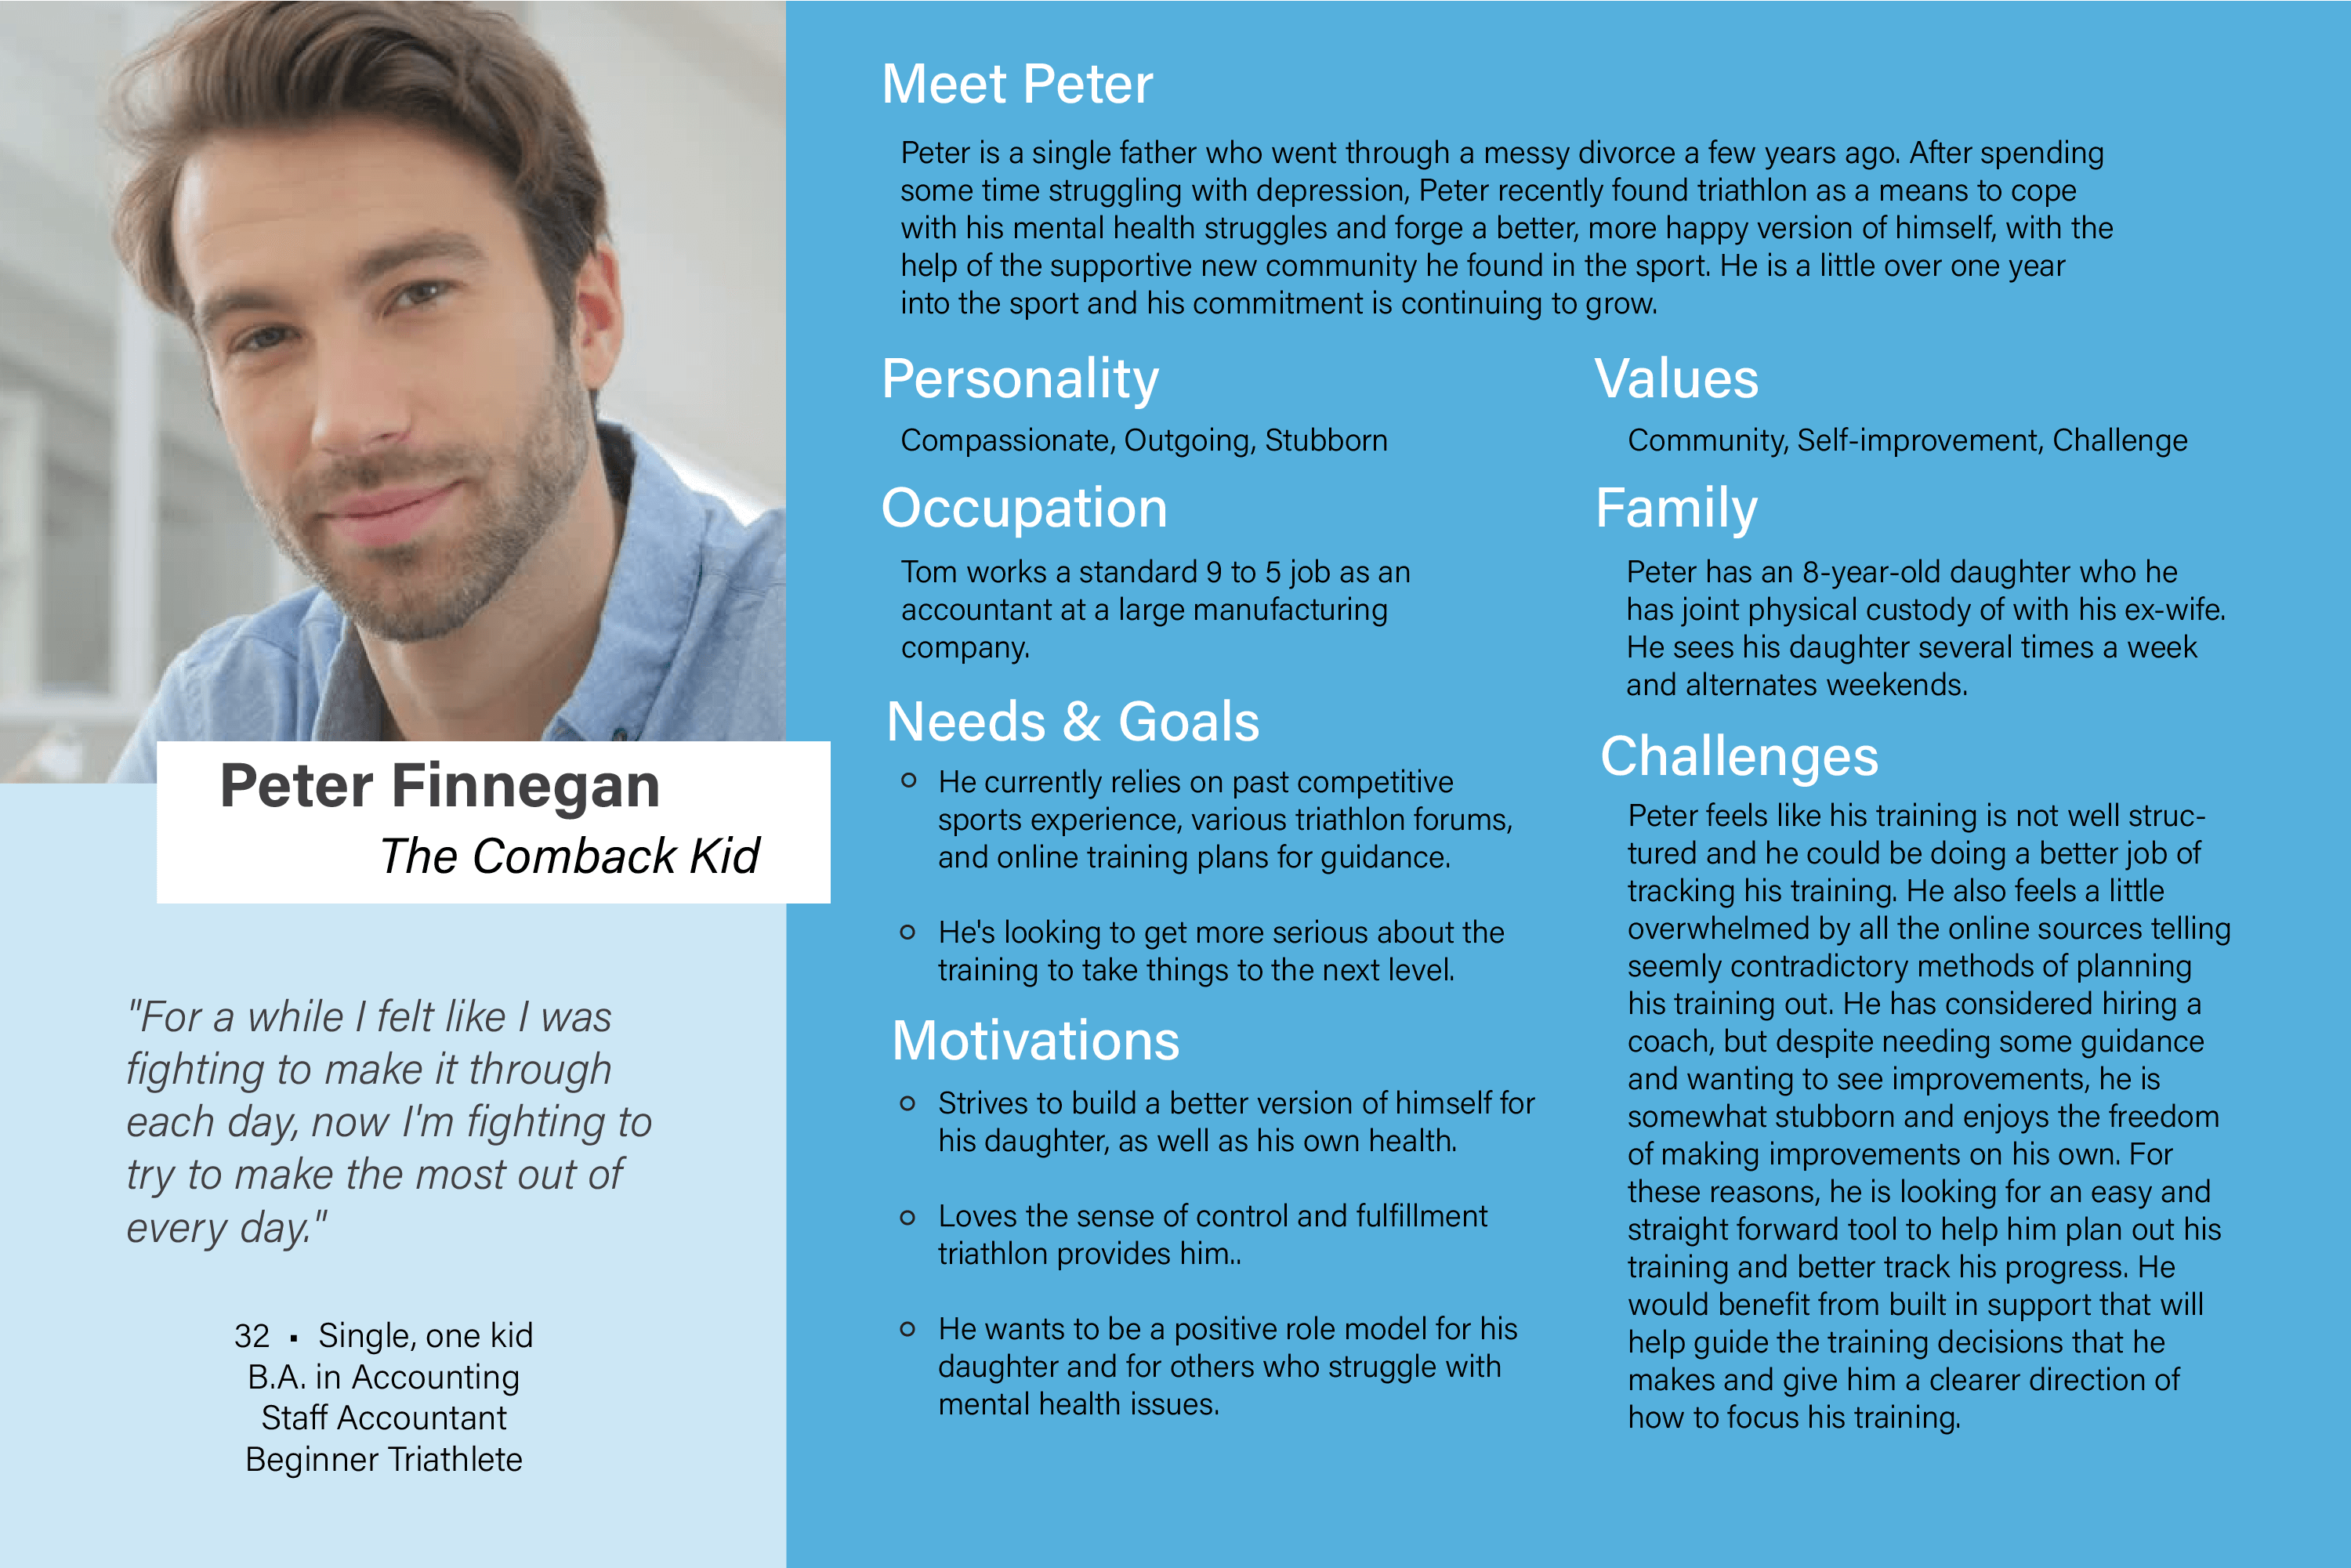
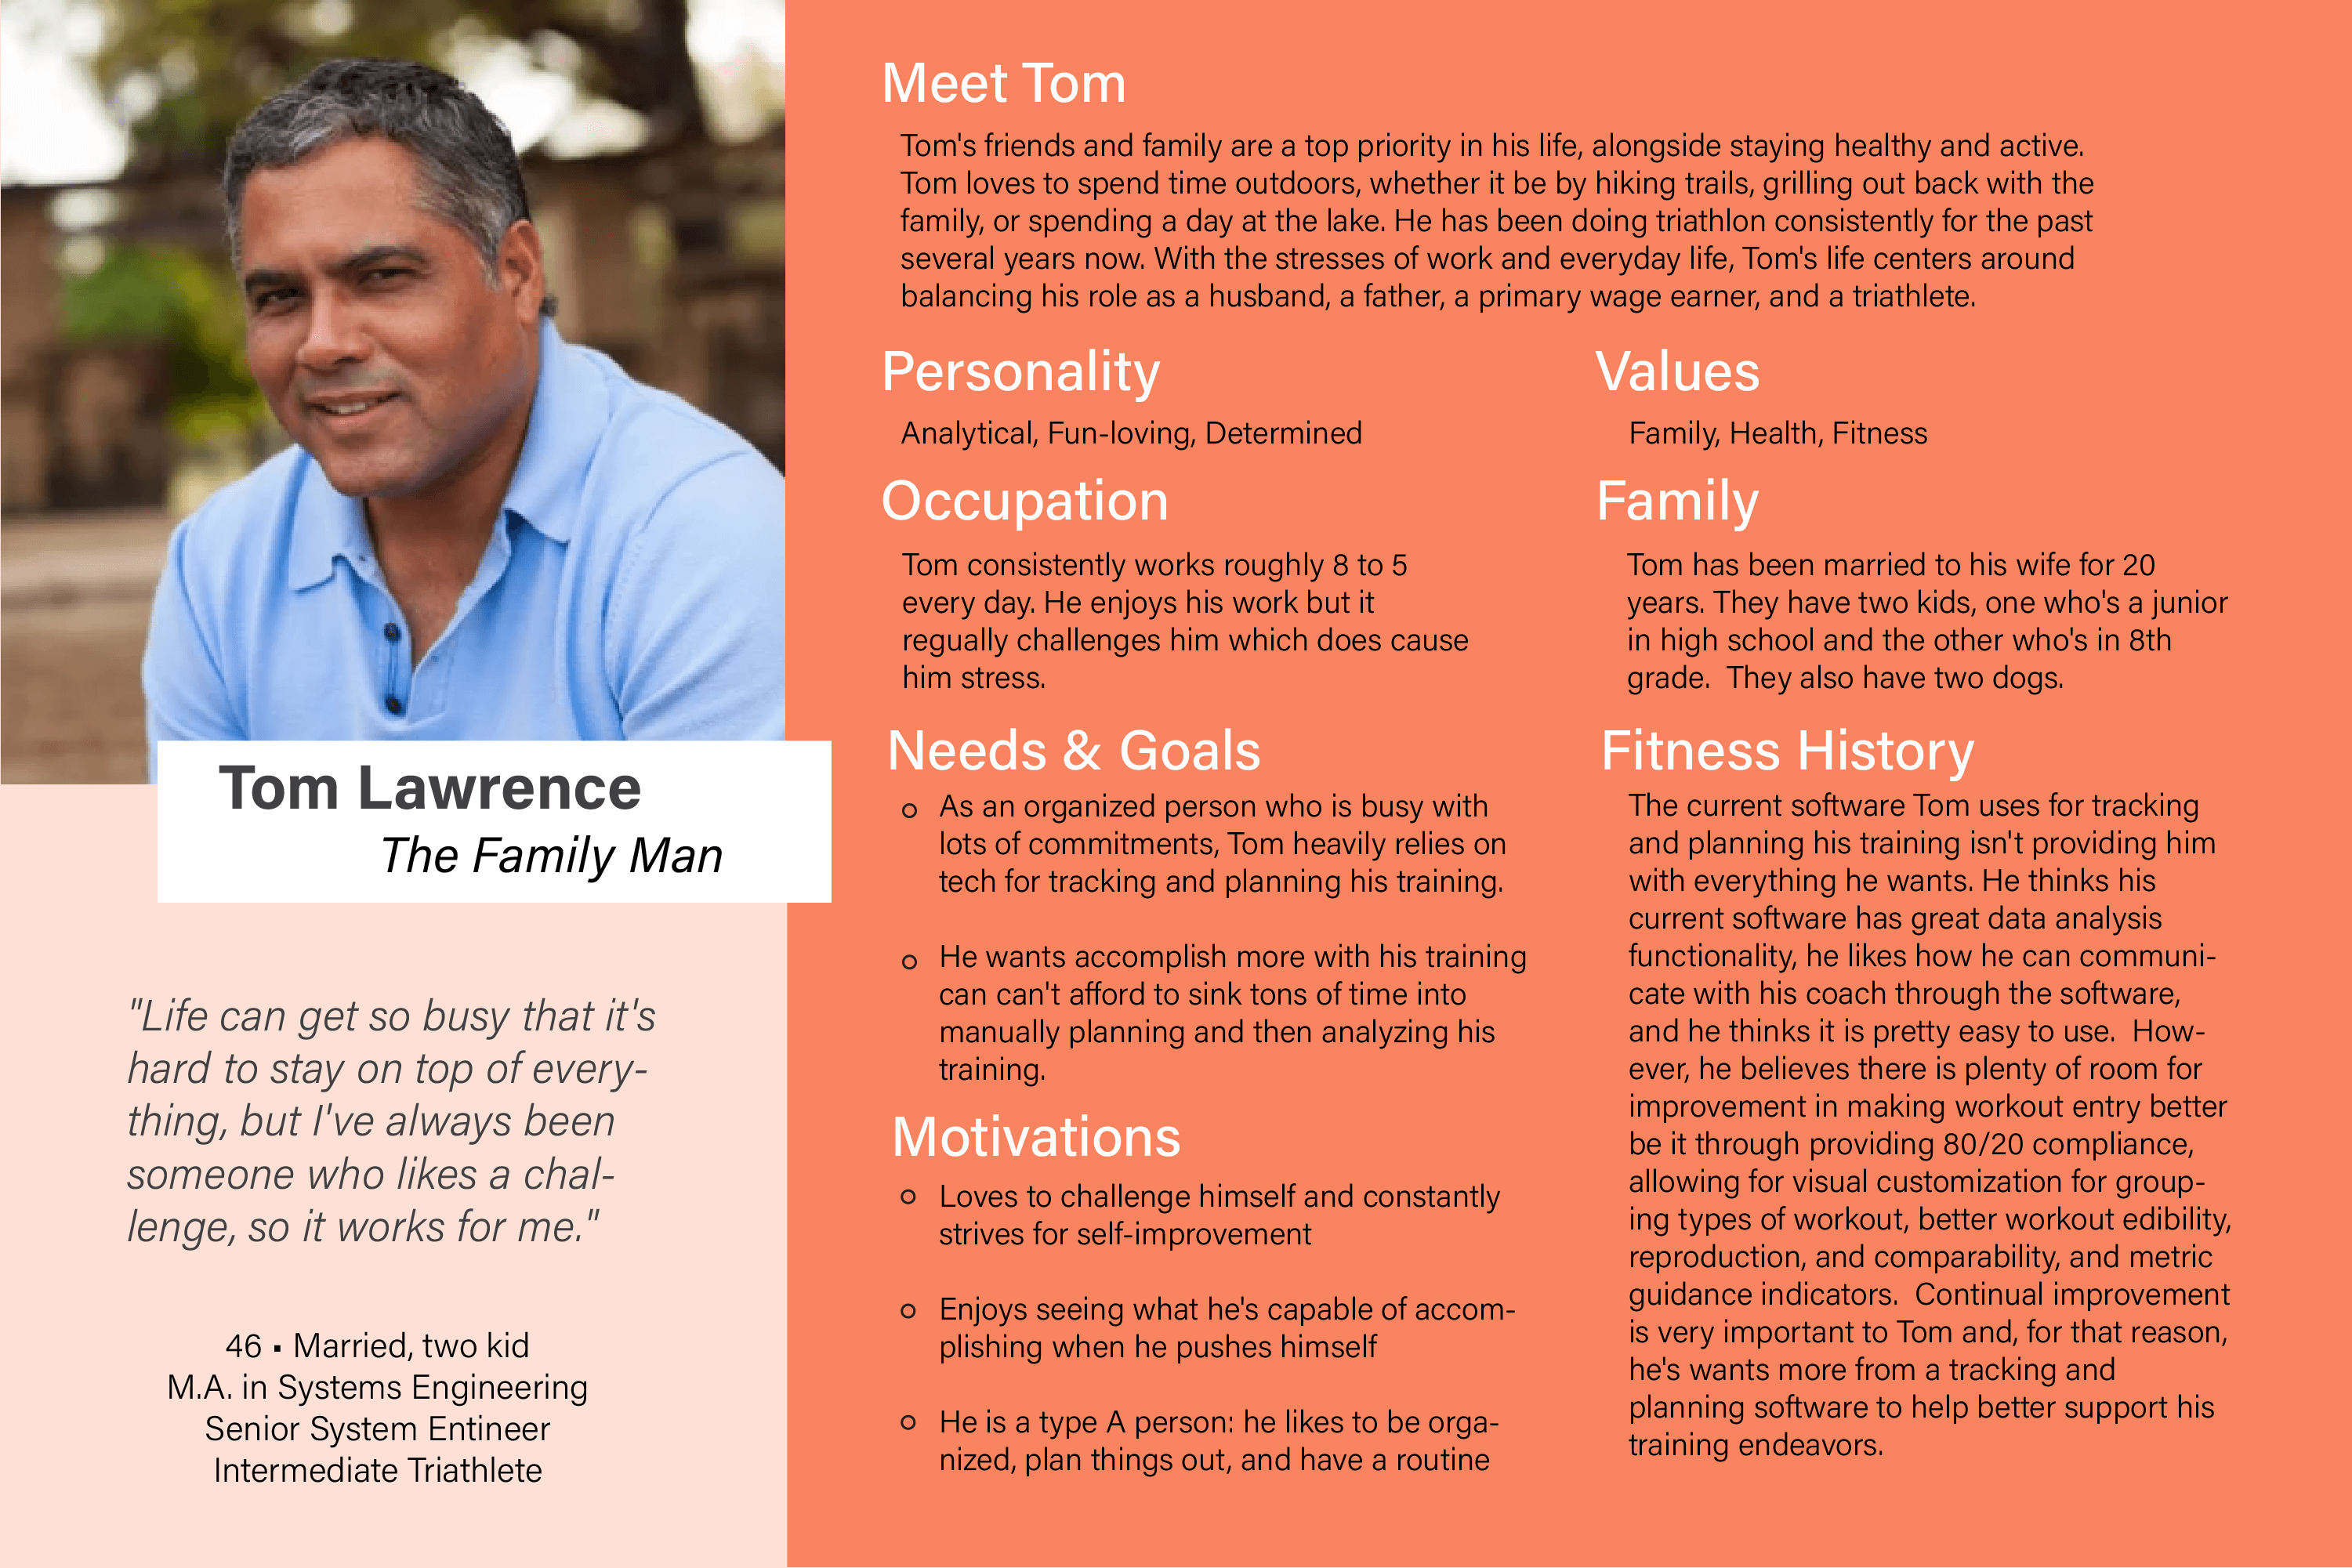
From the user survey data I collected, I gained a clear image of triathletes, what they do, and why they do it. I then used this image to distill the information into two personas that embody many of the common characteristics seen among the users I surveyed:
Vision Statement
Once I understood what problem I was trying to address and whom I was trying to design a solution for, I decided to define what TriUmphant would be. By creating the following vision statement, I hoped to rein in the scope of this project and give myself a concise objective that I would work towards:
TriUmphant is a tracking, planning, and performance analysis software for triathletes and endurance athletes. TriUmphant seeks to reduce the time users might need to analyze data manually. It provides ample support for planning out workouts through the use of pre-built workout types, workout customizability to fit the user's needs and time constraints, and suggested workout goals based on an optimization algorithm for the most efficient fitness improvements. This software aims to fill a coaching role by providing users with the resources to self-coach. TriUmphant makes it easy for beginners to find guidance on how to hit the ground running in their training without getting lost in the weeds from all the different metrics and training methods they might encounter online.
Develop
Braindump & Affinity Diagram
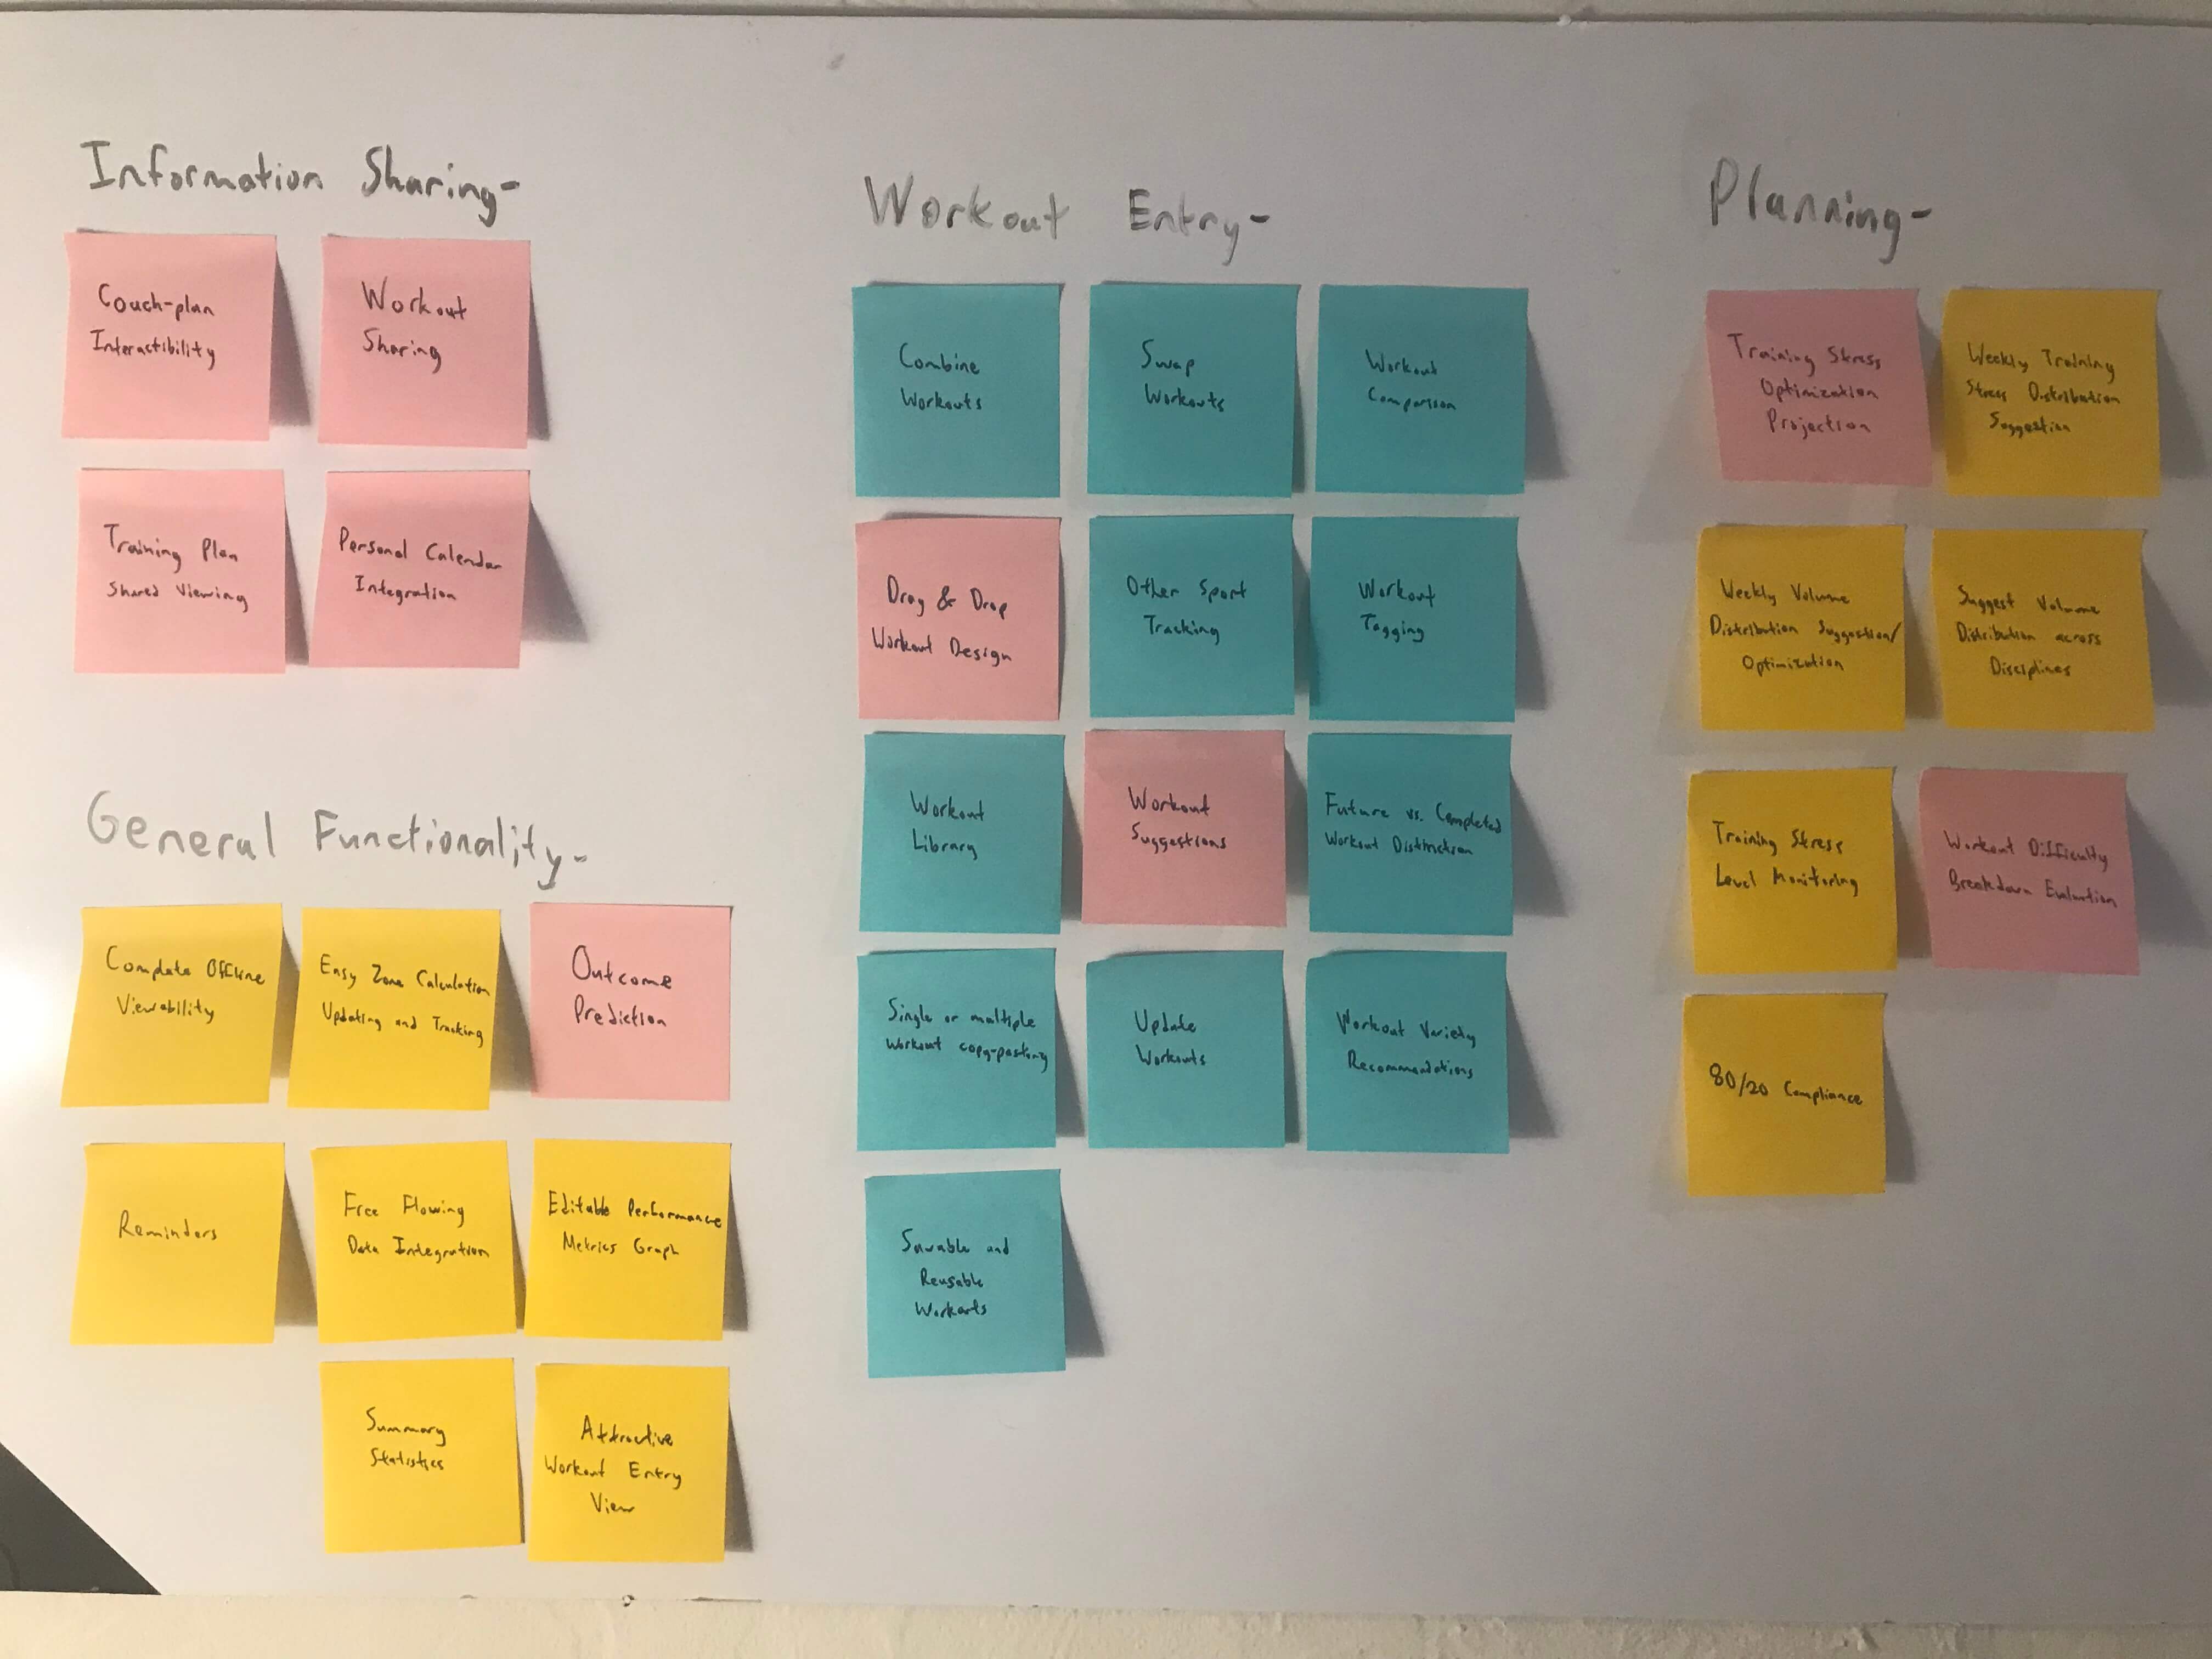
By this point, I already had a growing list of ideas. But I decided to formally kick off the Develop phase with a brain dump of any additional ideas I could synthesize from the feedback I received during my surveying and insights I uncovered during the competitive analysis and heuristic evaluation. After collecting an extensive list of ideas, I went through a process of review and categorization, creating an affinity diagram, which I used to better organize my thoughts before moving forward. I spent several hours refining my list of ideas and detailing how the functionality would work together.
Sketches
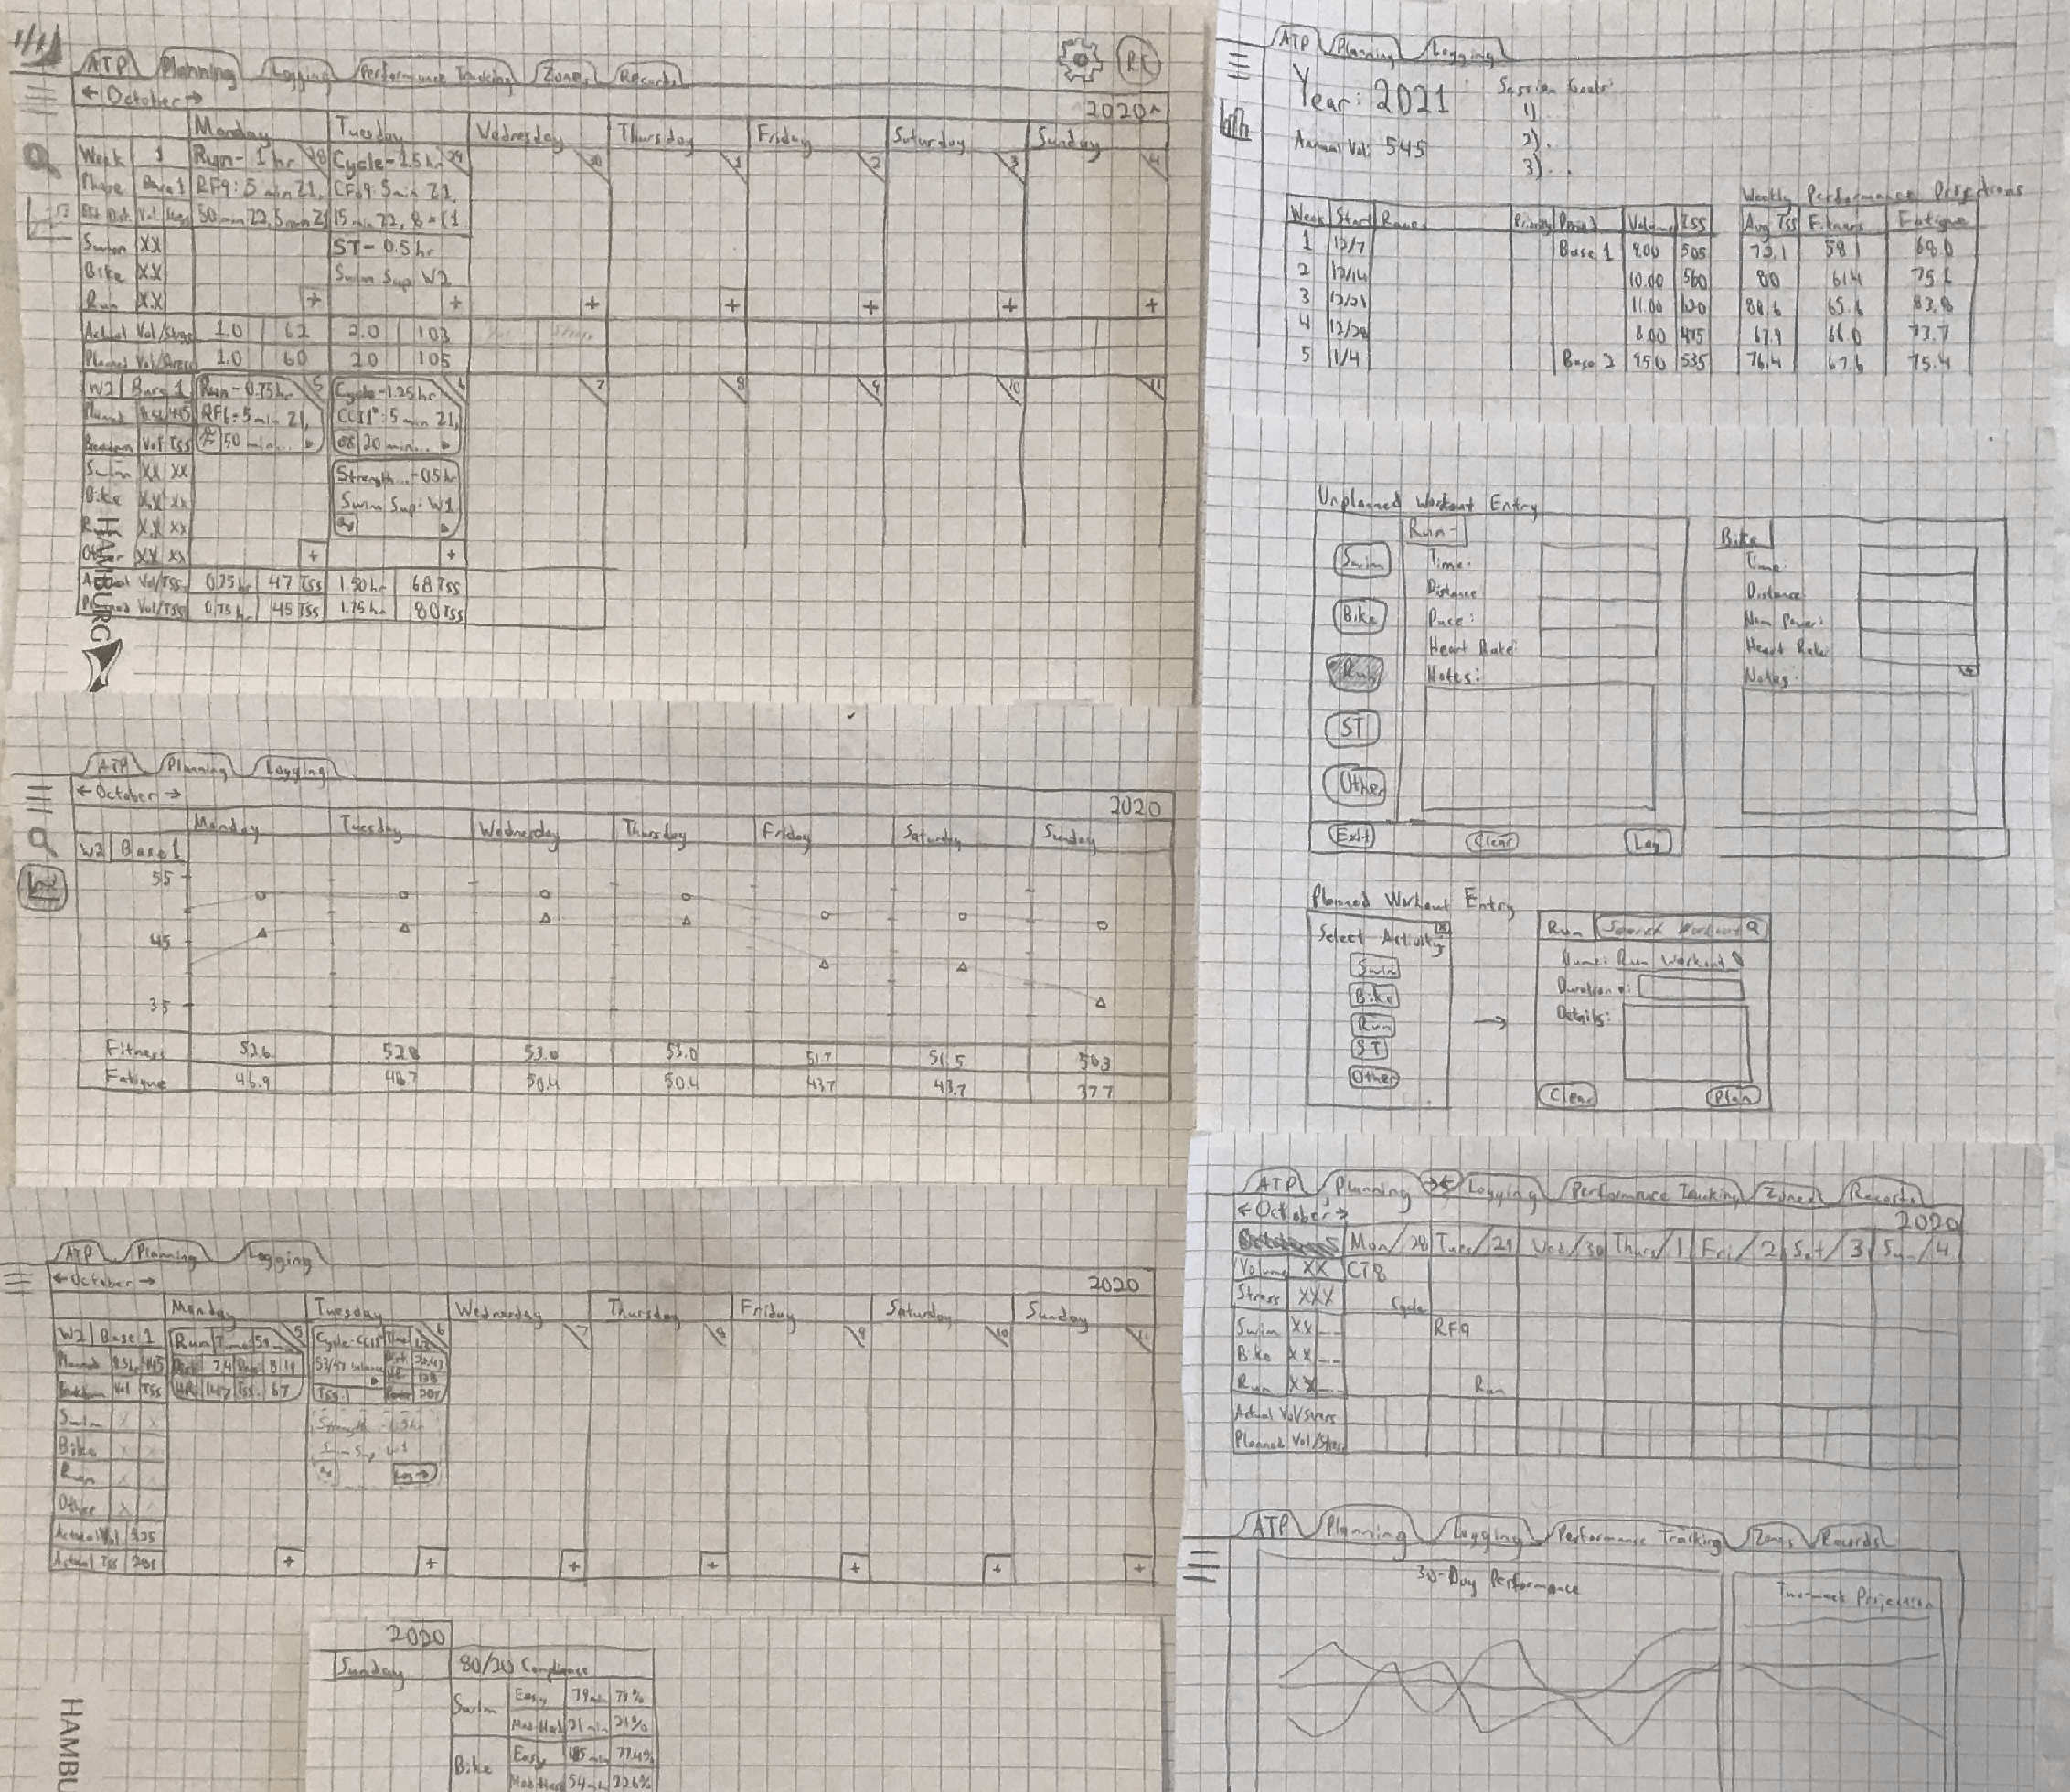
I then began sketching ideas for various pages I wanted to include in the application. I played around with different layouts, structures, and button placements, thinking about how best to present the performance data users want to see. There is a lot of data for users to look at, so pages can quickly get cluttered. Avoiding clutter was one of my top priorities.
Deliver
Semi-Functional Prototype
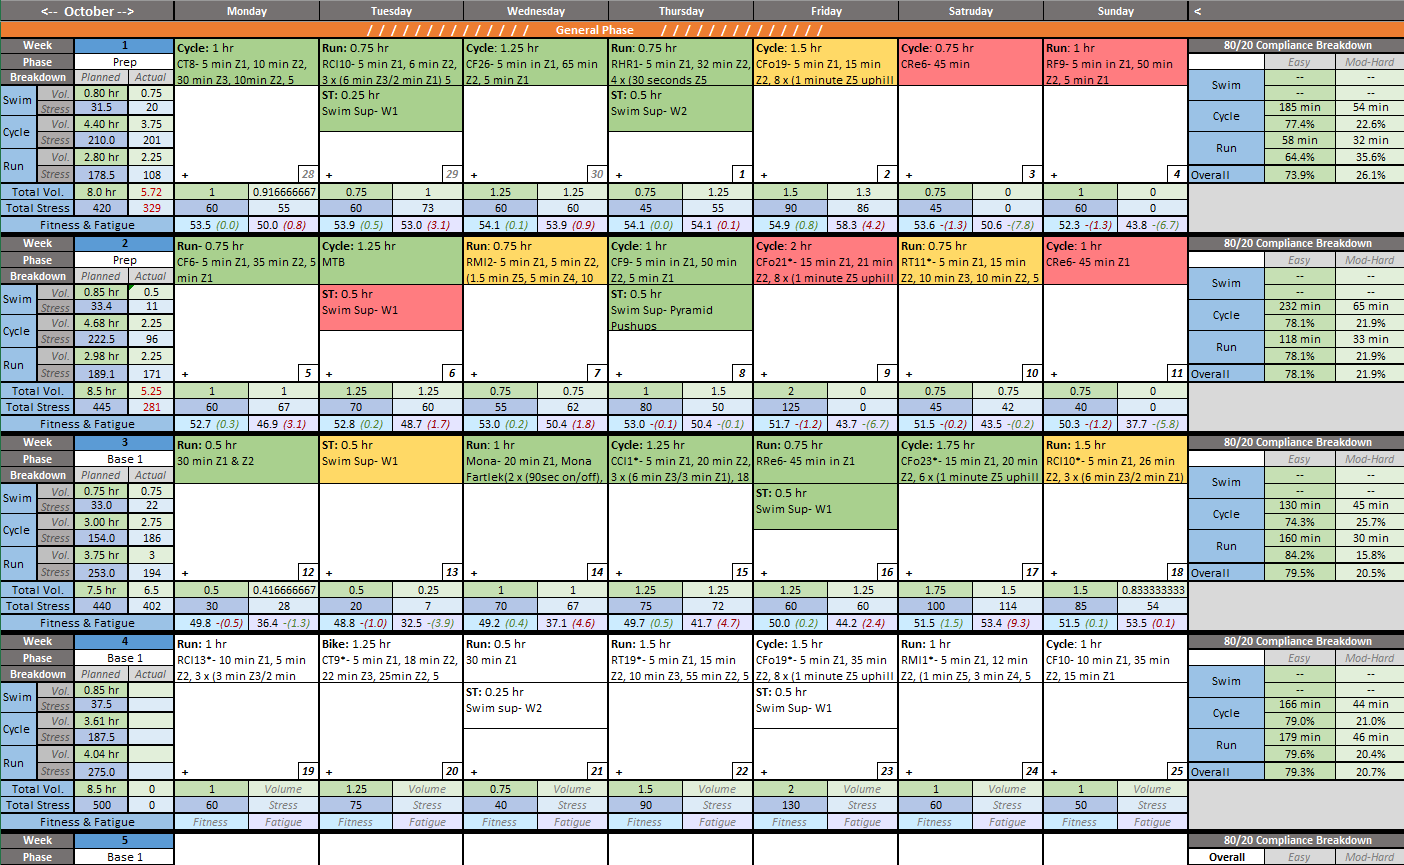
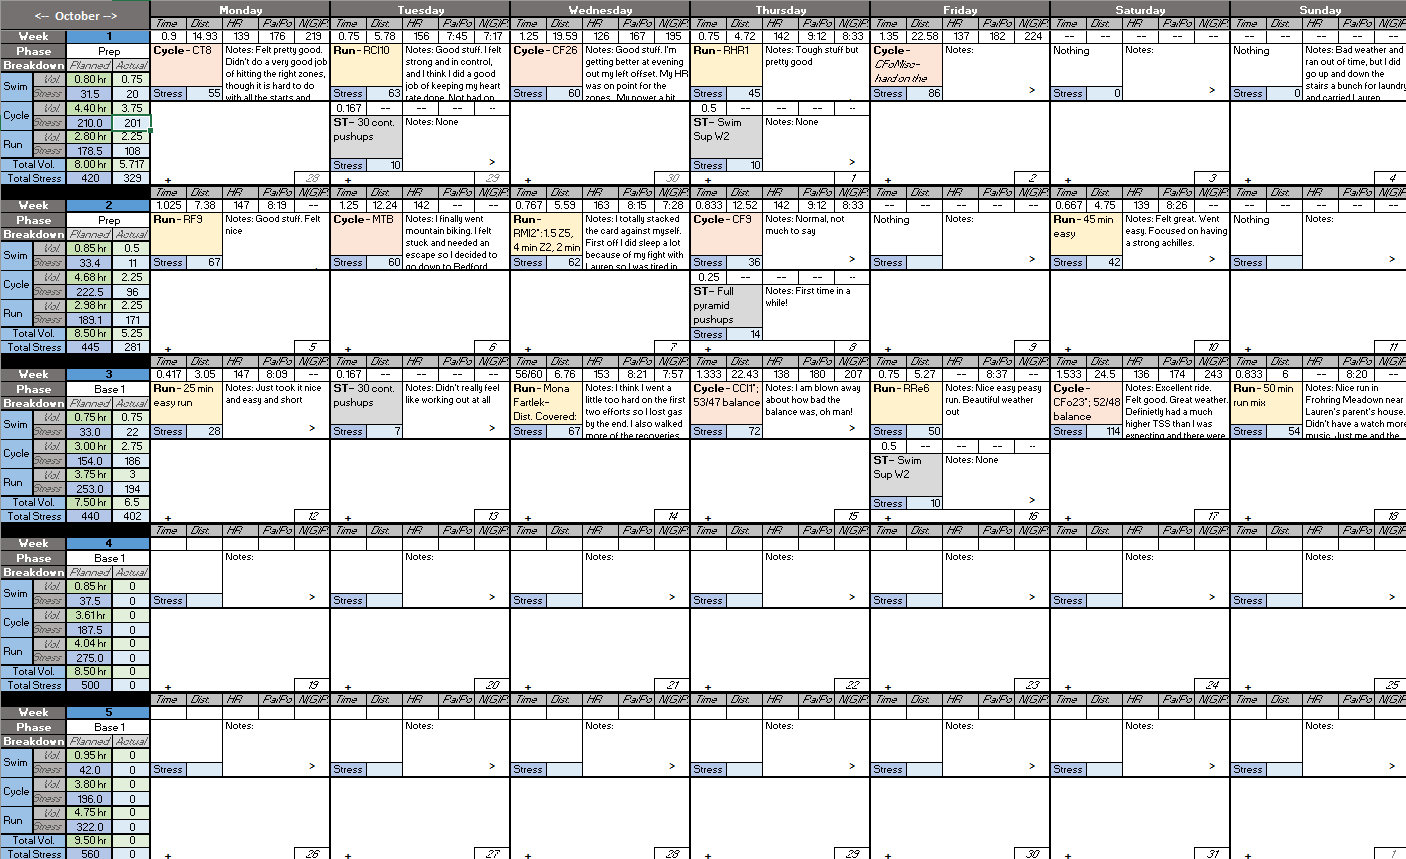
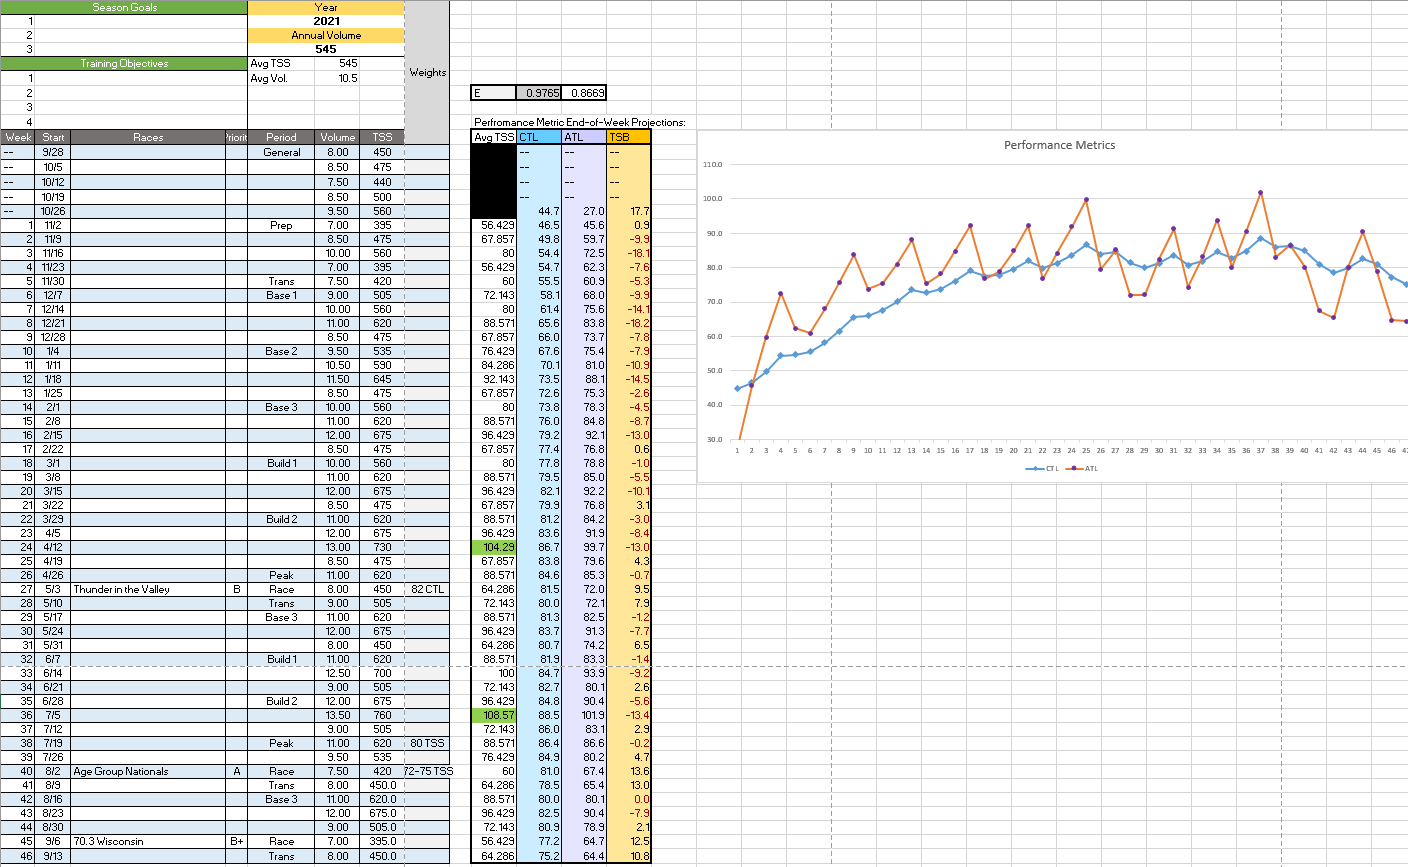
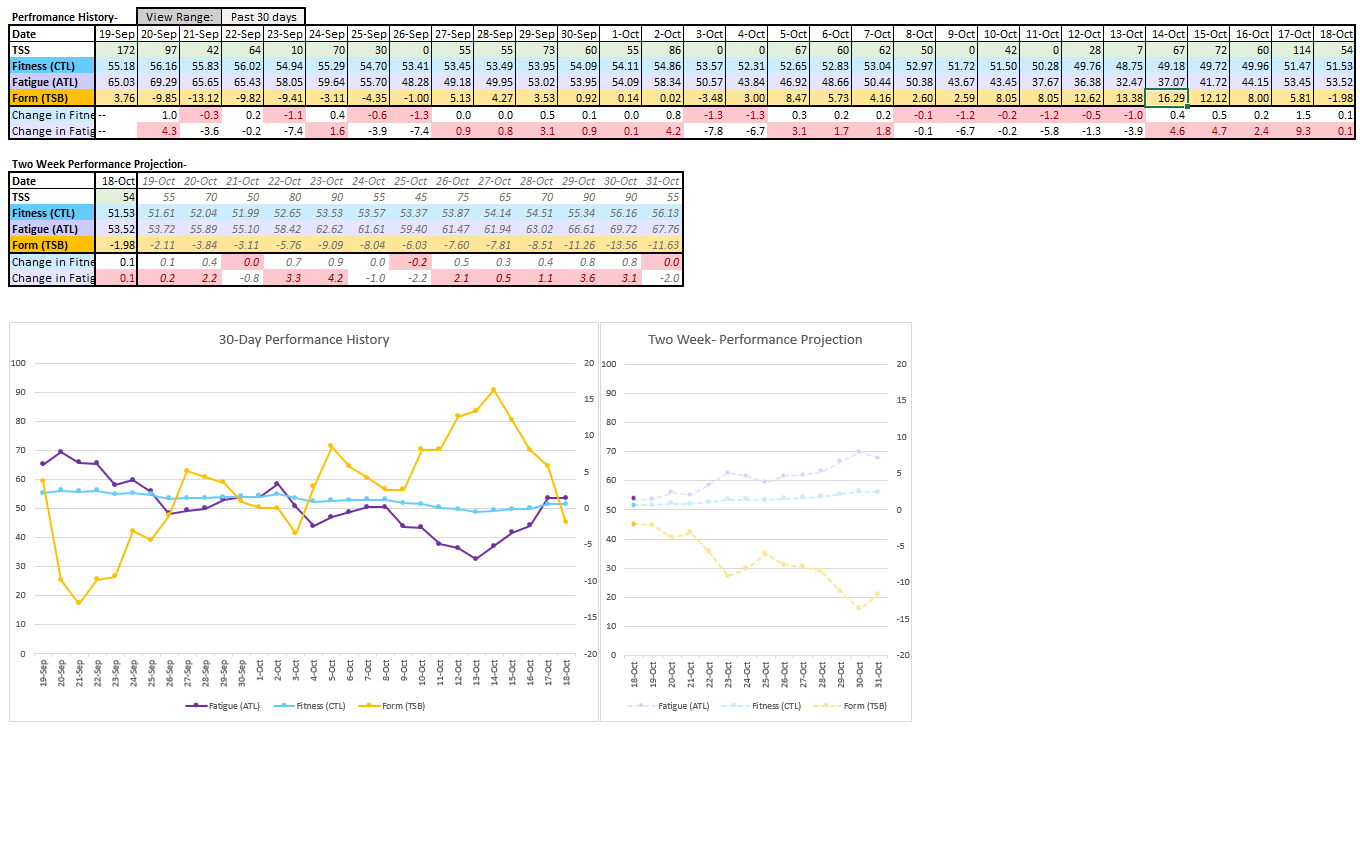
A lot of motivation for this project stemmed from my desire for a better tracking and planning application to replace my record in Excel. Given that I already had an existing functional structure, I used this as a base to design my prototype of TriUmphant. The upside to using Excel is that I could accommodate the complex calculations necessary to analyze training performance and see what information TriUmphant would display.
Wireframing & Usability Testing
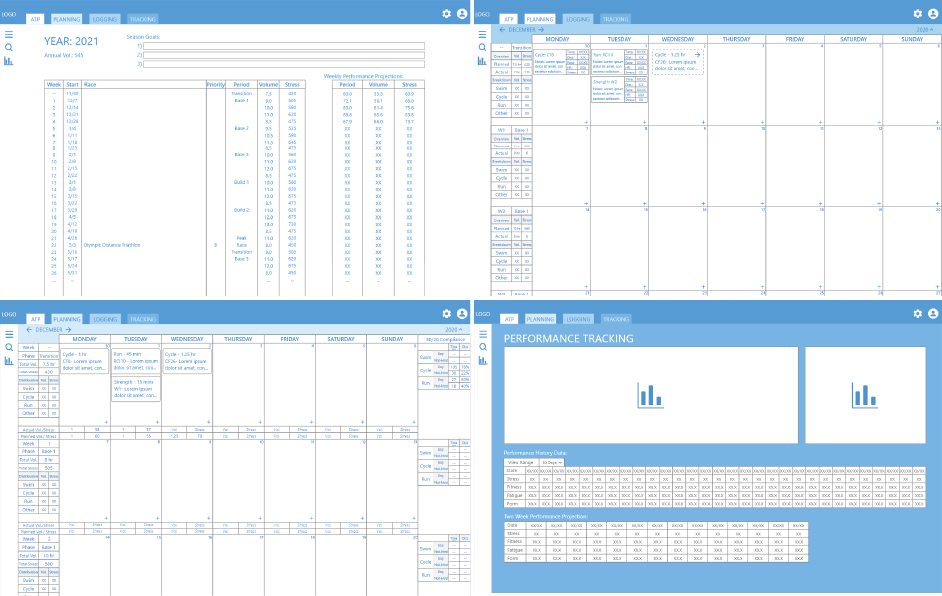
Having produced a prototype in Excel, there was a clear limit to the navigational and visual elements I could include, short of using macros. Thus, I saw making a wireframe in Adobe XD as a clear next step to help solidify page structures and the interactions between pages before mocking up more aesthetically pleasing UI elements.
To verify that the design was intuitive and productive, I conducted basic usability testing with friends and family by walking them through the Excel prototype to familiarize them with the basics of planning triathlon training. Then I had them click through the wireframe to test their ability to navigate the pages and consume the information on each page. Despite many of these testers being unfamiliar with triathlon training, feedback was positive, and everything seemed well received.
Visual Mock-up
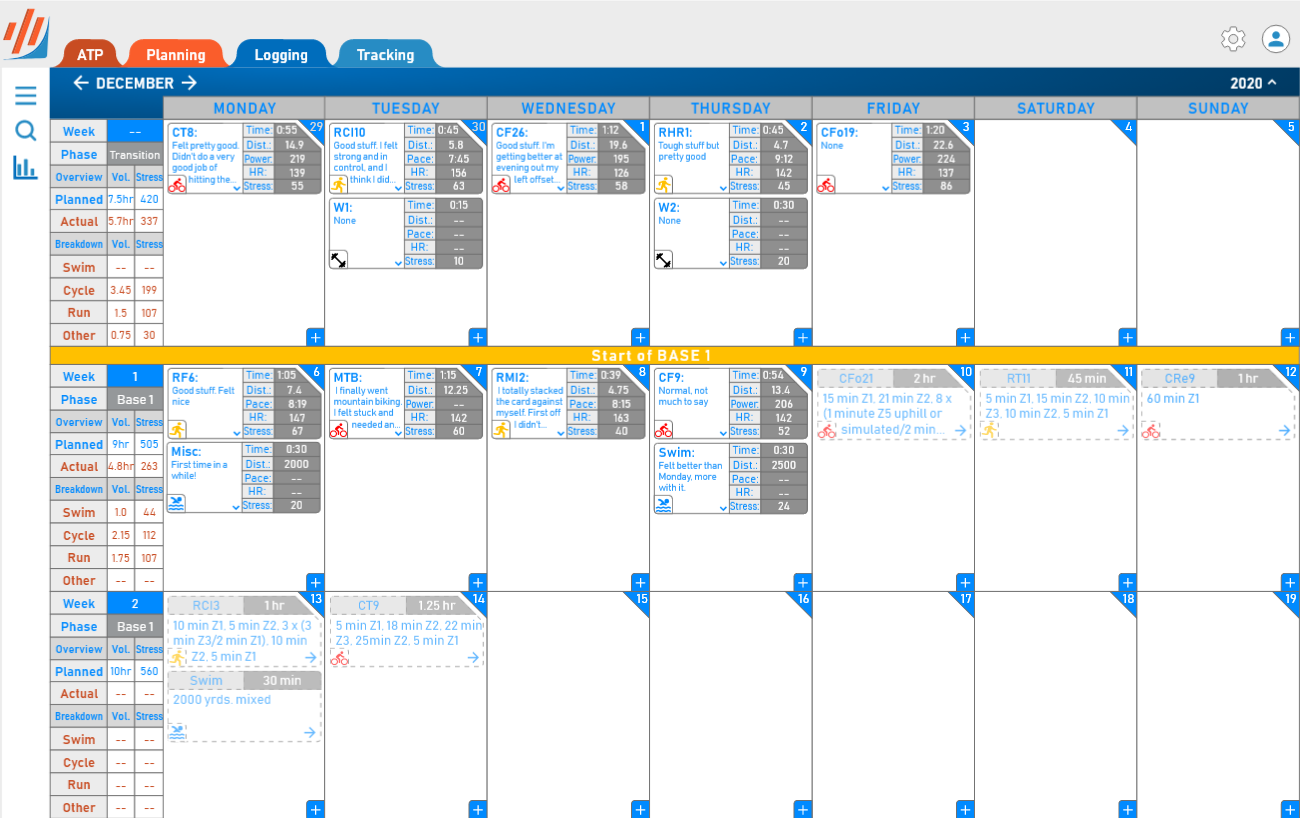
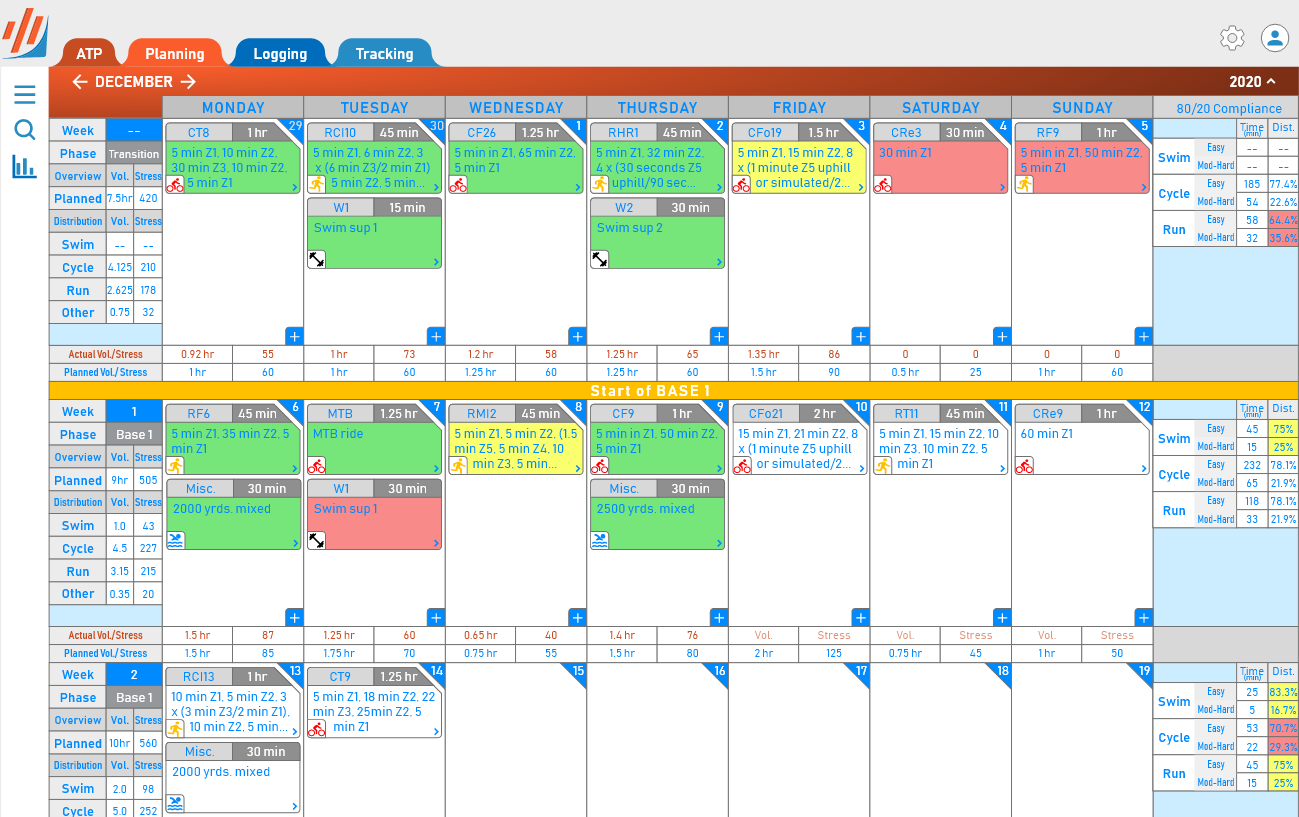
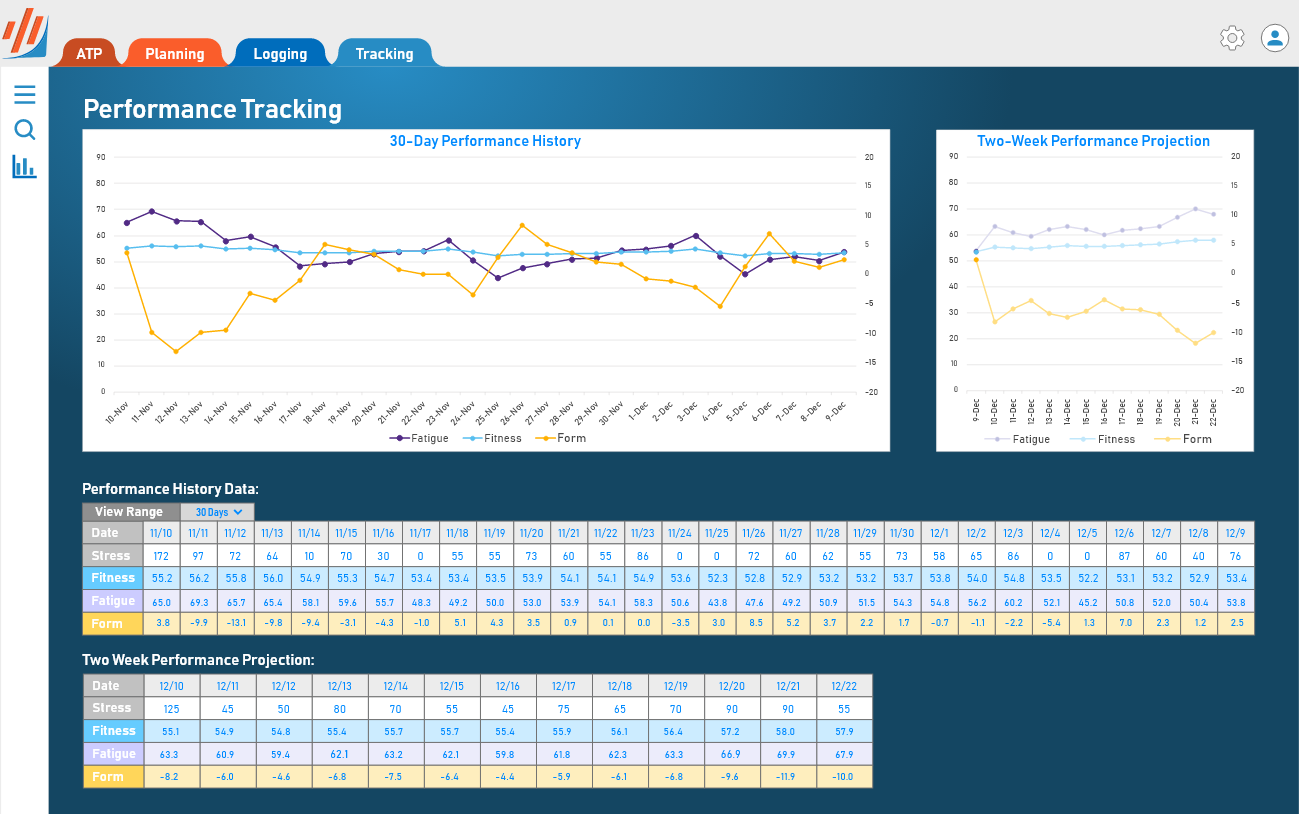
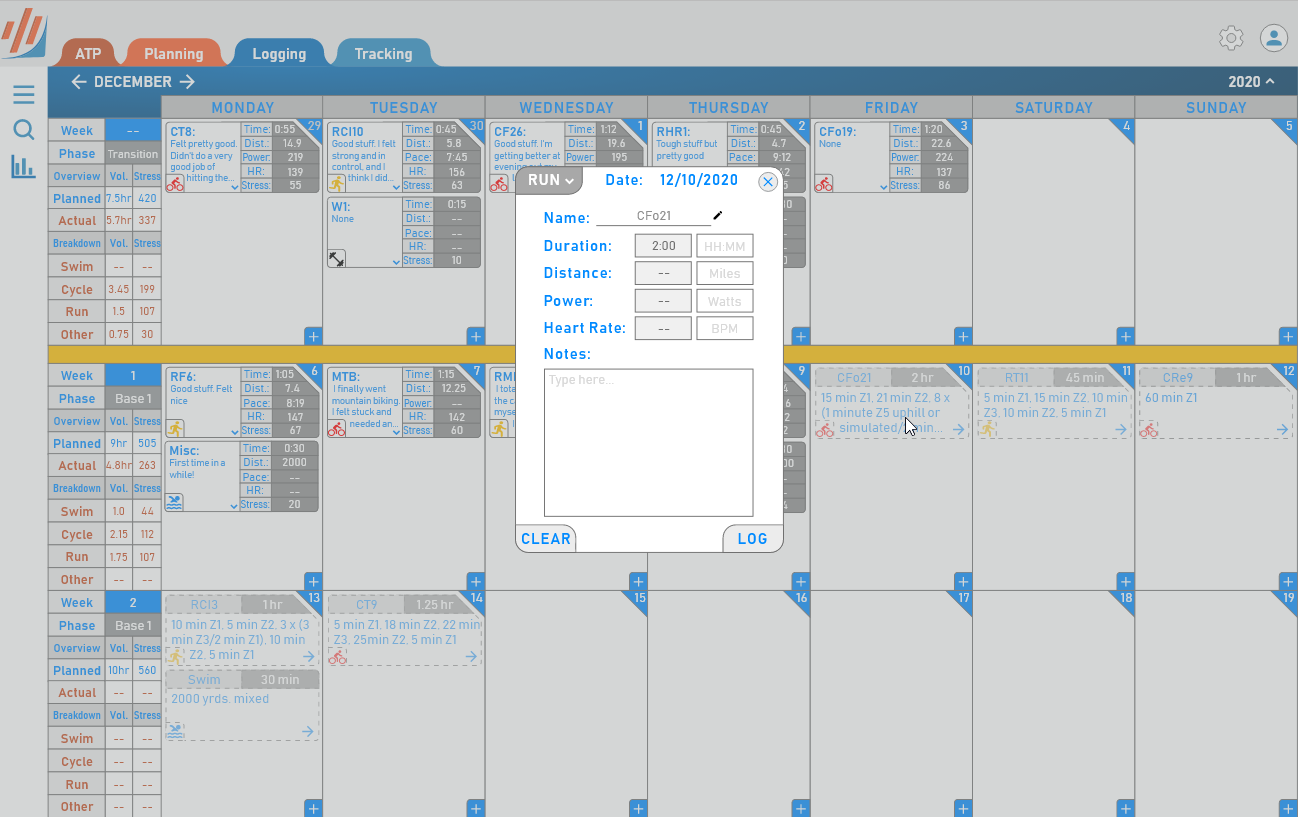
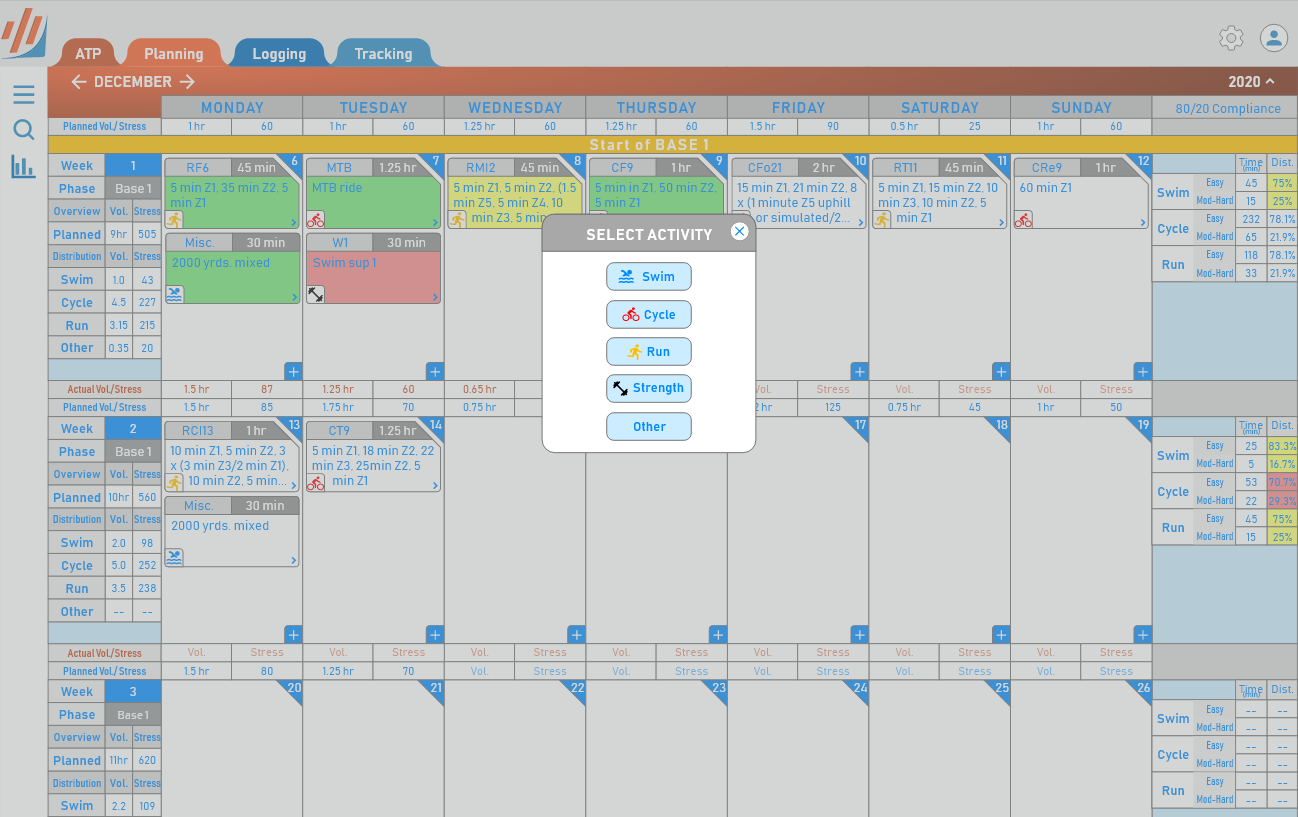
With both the functionality and navigation reviewed and validated by would-be users, I moved on to upping the aesthetics and adding more sample data to showcase TriUmphant in all its glory! Below you will find an interactive, high-fidelity prototype made using Adobe XD that showcases the primary navigation and display. Click on the tabs to explore.
Retrospective Note
Starting out in my design career, I did not know much about accessibility. I now cringe to see how many contrast issues this design has. This is the project I would redo if I had time because I regret the complete lack of accessibility in this design. Instead, this project is a reminder to do better and not make the same mistakes again.
--November 2022
Conclusion
TriUmphant is yet to be a complete product, but it's off to a solid start based on my feedback. This project was quite different from my previous work on Sidebar (check it out if you haven't already!). TriUmphant involves a different design outcome because of its abundance of numerical data. Handling this data created an exciting challenge when working on the project's UI: I constantly had to think about displaying the data without overloading the user. This balancing act forced me to rely on using font-weight and consistent color coding to help visually segregate information on each page. In doing so, I received invaluable practice in defining a UI style and then carrying it throughout the application such that even when a user comes to a new activity page, there is a familiarity in the design that helps provide innate usability.
The next steps for this project include mocking up additional functionality I hope to have in the final product and conducting more formal user testing. Following that, I will develop the first iteration of the entire product!

 Home
Home
